Description of the project dashboard
Updated this month
After creating a new project, you'll see its detail, where you can set up everything you need. In this part of the manual, you'll find a description of the individual parts of the project dashboard.
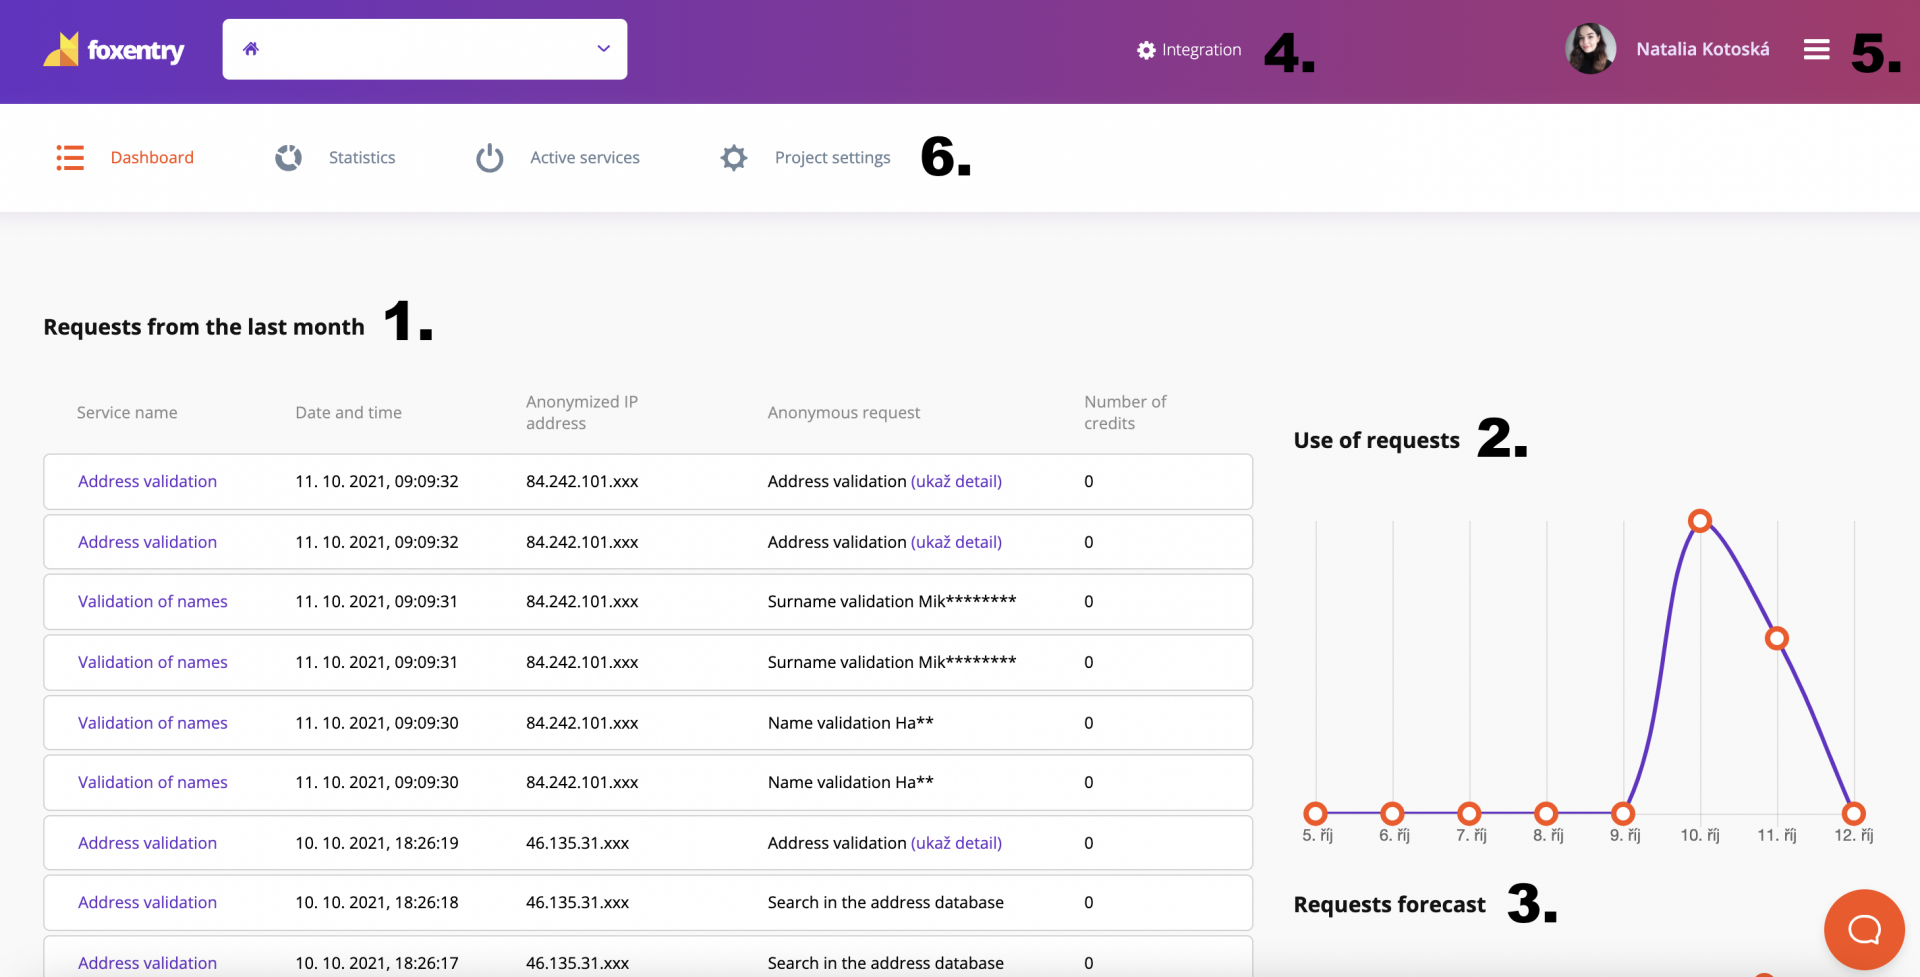
- The main part of the screen are the Requests from the last month:
- what service the user used, whether he/she entered a request for validation of e-mail, name, address, etc.
- specific time of service use
- anonymized user IP address
- anonymized content of the user's request
- how much did the given credit request cost (in the case of the project API)
- In the top graph on the right, you'll find the usage of requests for the last week.
- In the chart below, you can see the likely use of the requests in the future.
Header
- In Integration at the top, you can find the script for embedding into your page.
- Foxentry account settings.
- From the main menu, you can go to:
- Statistics - graphs of requirements in individual validators for the selected period
- Active services - activation and deactivation of individual services
- My team - list of members working with your project, possibility to add a new member
- Project settings - all settings related to your project